repoze.profile Documentation
This package provides a WSGI middleware component which aggregates profiling data across all requests to the WSGI application. It provides a web GUI for viewing profiling data.
Configuration via Python
Wire up the middleware in your application:
from repoze.profile import ProfileMiddleware
middleware = ProfileMiddleware(
               app,
               log_filename='/foo/bar.log',
               cachegrind_filename='/foo/cachegrind.out.bar',
               discard_first_request=True,
               flush_at_shutdown=True,
               path='/__profile__',
               unwind=False,
              )
The configuration options are as follows:
- ``log_filename`` is the name of the file to which the accumulated
  profiler statistics are logged.

- ``cachegrind_filename`` is the optional name of the file to which
  the accumulated profiler statistics are logged in the KCachegrind
  format.

- If ``discard_first_request`` to true (the default), then the
  middleware discards the statistics for the first request:  the
  rationale is that there are a bunch of lazy / "first time"
  initializations which distort measurement of the application's
  normal performance.

- If ``flush_at_shutdown`` is true (the default), profiling data will
  be deleted when the middleware instance disappears (via its
  __del__).  If it's false, profiling data will not be deleted.

- ``path`` is the URL path to the profiler UI.  It defaults to
  ``/__profile__``.

- ``unwind`` is a configuration flag which indicates whether the app_iter
  returned by the downstream application should unwound and its results read
  into memory.  Setting this to true is useful for applications which use
  generators or other iterables to do "real work" that you'd like to
  profile, at the expense of consuming a lot of memory if you hit a URL
  which returns a lot of data.  It defaults to false.
Configuration via Paste
Wire the middleware into a pipeline in your Paste configuration, for example:
[filter:profile]
use = egg:repoze.profile
log_filename = myapp.profile
cachegrind_filename = cachegrind.out.myapp
discard_first_request = true
path = /__profile__
flush_at_shutdown = true
unwind = false
...

[pipeline:main]
pipeline = egg:Paste#cgitb
           egg:Paste#httpexceptions
           profile
           myapp
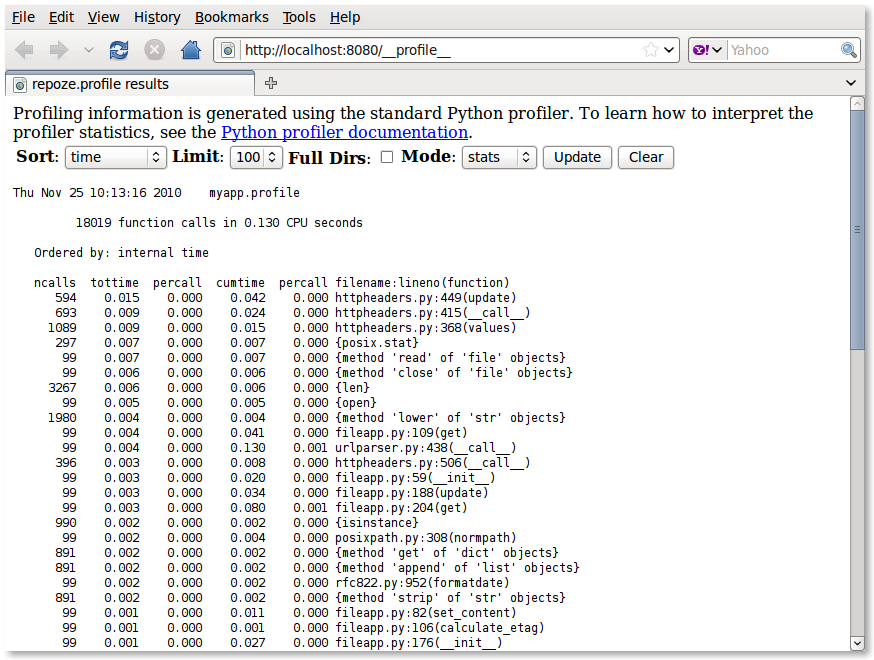
Viewing the Profile Statistics
As you exercise your application, the profiler collects statistics about the functions or methods which are called, including timings. Please see the Python profilers documentation for an explanation of the data which the profiler gathers.
Once you have some profiling data, you can visit the configured path
in your browser to see a user interface displaying profiling statistics
(e.g. http://localhost:8080/__profile__).
Profiling individual functions
Sometimes it might be needed to profile a specific function, be it for analyzing a bottleneck found with the full profiling, or to compare different approaches to the same problem. This package provides a decorator for this case. To use it, simply decorate the desired function like this:
from repoze.profile.decorator import profile

@profile('Descriptive title', sort_columns=('time', 'cumtime'), lines=30)
def my_bottleneck():
    # some really time consuming code
The results of the profiling will be sent to standard out. The title will
appear at the top of the results, for guidance. All other arguments are
optional. sort_columns allows specifying the columns to sort the timing
results. See the Python profilers documentation for available options. lines
is the number of lines of results to print. Default is 20. Zero means no limit.
Reporting Bugs / Development Versions
Visit https://github.com/repoze/repoze.profile/ to report bugs. Fork the repository to submit patches as pull requests.